Modern Capitalism in Two Charts
Two Charts that capture the essence of Capitalism in our times

Everything you wanted to know about Capitalism in our times, often referred to as Neoliberalism or “trickle down Economics”, can be captured in just two charts.
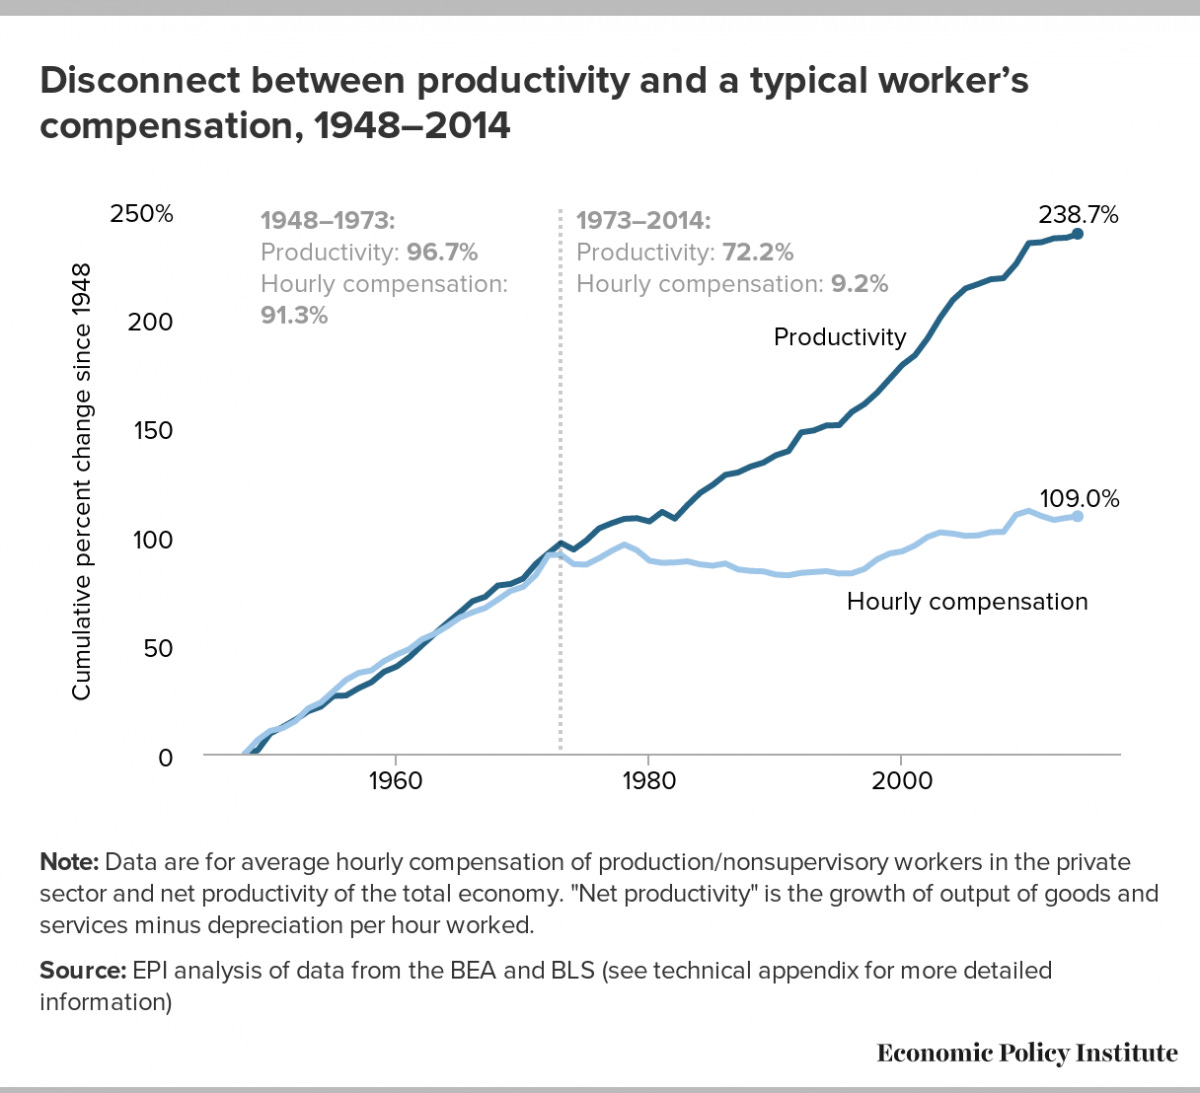
The 1st chart shows growing gap between productivity and worker wages since 1973. In response to the Great Depression, when Capitalism almost collapsed, and the threat from an alternate Soviet Model, Capitalism resorted to Keynesian Economics. The post-war era was characterised by the establishment of welfare states where wage growth matched productivity growth and workers wages rose dramatically. This was the golden age of Capitalism. However, from mid-70s, the welfare state gets progressively dismantled and Labour Rights withdrawn resulting in wage stagnation while productivity continues its earlier trajectory. This results in growing inequality with all the gains from production accumulating to the top 1% of the population while the wages for rest of the population stagnates. The promised “trickle down” never happens!
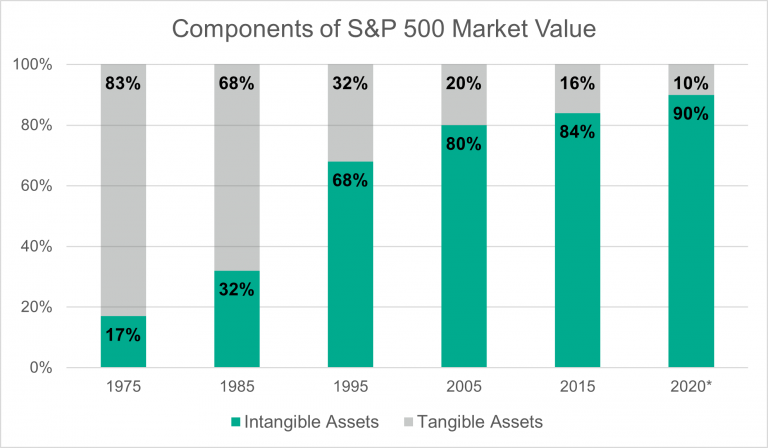
The 2nd chart shows the percentage of tangible and intangible assets held by the top 500 US companies. Tangible assets are what are referred to as fixed capital. Things like factories, land, machinery, etc. Intangible assets are things like intellectual property, patents, brand value, etc. What the chart shows is till the early 1970s, the bulk of assets held by the top American companies were in the tangible assets. This is what you would expect from an industrial powerhouse. However, as production is shifted to the 3rd world to cut wages, US (and more generally the West) declines as an industrial power. From 83% tangible assets and 17% intangible assets in 1975, the top US companies have gone to 90% intangible assets and only 10% tangible assets. The focus of Western companies has shifted to the relentless pursuit of patents and “intellectual property”, branding and in the last decade people’s personal data. It is this imprisonment of knowledge and theft of personal data which marks “advanced” Capitalism today.